Debugging
Foreword
Emu68, the core of the PiStorm accelerator, is a bare-metal software. Because of this, it cannot write debug information to the SD card, USB, or network, as all of these interfaces are, or will be, controlled by AmigaOS m68k drivers.
If you need to obtain debug data from Emu68, a serial interface must be attached to the PiStorm. With the help of a second machine, you can either monitor the live debug stream as it is produced or record it for later analysis.
Emu68 supports two modes of operation for the debug interface:
- Asynchronous RS232 unidirectional transmission at 926 kbps (kilobits per second)
- Synchronous unidirectional transmission at variable speeds
In both cases, the data is generated and transmitted using a bit-banging technique. This is necessary because none of the available GPIO alternate functions on the Raspberry Pi allow the use of a hardware serial port. As a result, asynchronous RS232 mode may suffer from significant transmission errors, since two CPU cores attempt to bit-bang the GPIO lines simultaneously: CPU0 for Emu68–PiStorm communication and CPU1 for sending debug data from a ring buffer.
For this reason, the synchronous mode is recommended. Here, clock information is sent over an additional wire, which ensures reliable transmission even when the data rate varies due to concurrent GPIO activity. Since no strict timing rules need to be followed, this mode is also faster and less intrusive, particularly when large volumes of debug data are generated.
Hardware interface
If you choose the RS232 mode, you are free to use any 3.3 V TTL-compatible serial interface. Based on the PiStorm community’s experience, FTDI-based adapters have proven to be reliable. The transmission format is 8N1: 8 data bits, no parity, and one stop bit, which is a standard configuration for low-level serial debugging.
For synchronous mode, use an interface based on the FT232H family of chips. Be sure to select an H version (FT232H, FT2232H, FT4232H); the regular FT232 will not work because it does not support the required fast serial mode. In synchronous mode, two signals are used:
- AD0 - data wire
- AD1 - clock wire
These two pins can usually be found on the board of your chosen interface, labeled either as D0/D1 or ADBUS0/ADBUS1. Refer to the board documentation or schematic to confirm. If in doubt, the Adafruit FT232H breakout board is a safe option.
Before use, the FT232H interface typically requires one additional step: the fast serial mode must be enabled with the FT_Prog tool from FTDI. In this tool, configure the port connected to the debug interface to OPTO Isolate mode, as shown below:
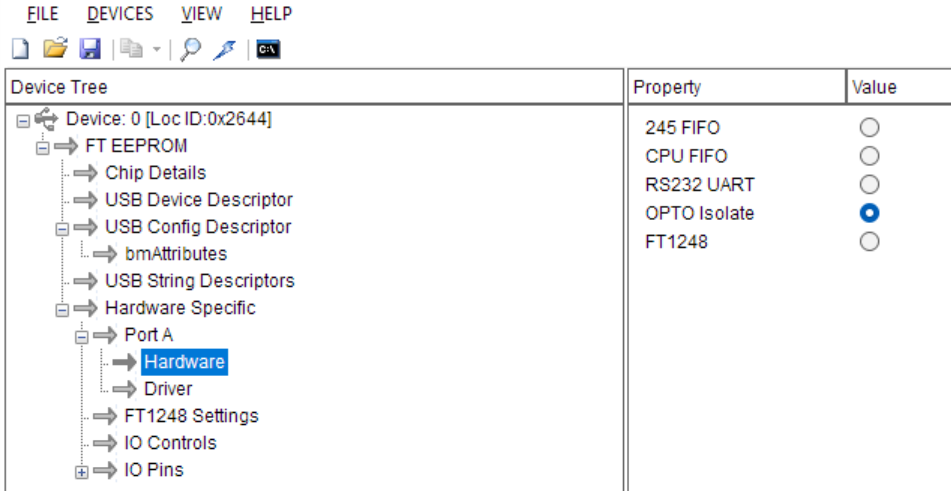
After switching to OPTO Isolate mode, your FT232H interface is ready to use.
Classic PiStorm
On the classic PiStorm, the serial interface is not explicitly exposed. You will need to solder either two or three wires – GND, Data, and optionally Clock – to the 40-pin Raspberry Pi header. This can be done on either the Raspberry Pi side or the PiStorm side. The relevant signals are:
- RS232 mode: data on GPIO26 (Pin 37)
- Synchronous mode: clock on GPIO26 (Pin 37), data on GPIO27 (Pin 13)
Please refer to the official RaspberryPi documentation for location of these GPIO pins on the connector.
PiStorm32-Lite
On the PiStorm32-Lite, the debug header is available on the extension port:
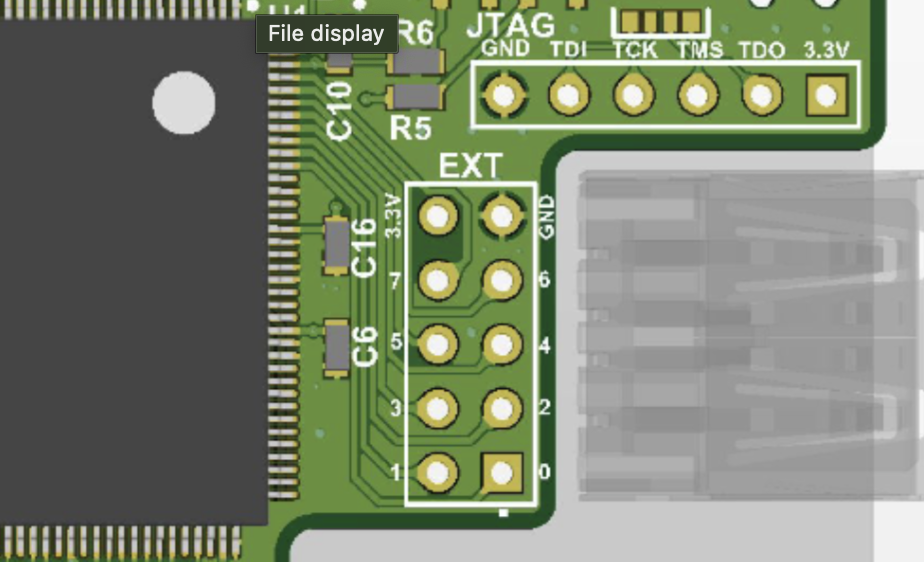
Debug signals:
- Pin 0 (marked with a square) carries the data signal.
- Pin 1 carries the clock signal when using synchronous mode.
- GND is also available on the same connector.
PiStorm16
The PiStorm16 uses the same extension port as the PiStorm32-Lite, but it is located on the edge of the board. The top side of the connector exposes pins 0, 2, 4, 6, and 8, while the bottom side carries pins 1, 3, 5, 7, and 9. Pin 0 is marked with a small triangle on the top side of the board:
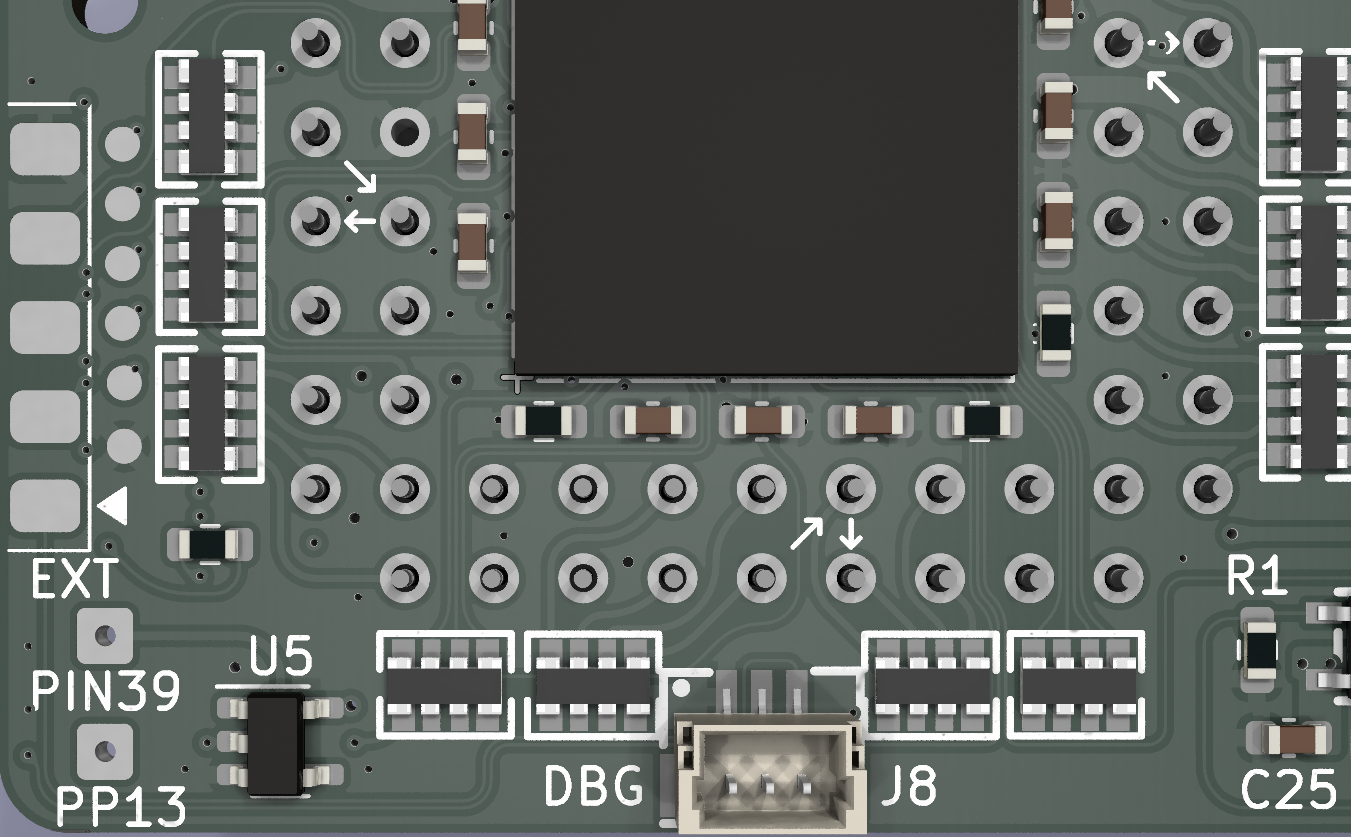
Debug signals:
- Pin 0 provides the data signal in both modes of operation.
- Pin 1 (on the bottom side) provides the clock signal in synchronous mode.
- GND is available on Pin 8 of this connector
In addition, the same debug signals are exposed on a JST connector labeled DBG, with the following pin order (left to right): GND, Clock, Data.
Software
FastSerial
For receiving debug data in synchronous mode, you can use the FastSerial tool. This is a command-line utility based on the FTDI ftd2xx libraries. Please install the drivers from this link.
The FastSerial project will soon be available on GitHub. For now, you can download prebuilt executables:
- Windows 11 (x64): FastSerial_win64.zip
- Linux (x86_64): FastSerial_linux_x64.zip A macOS build will be provided later.
Once the FTDI drivers are installed, start the FastSerial executable:
> FastSerial.exe
Listening on fast serial port...
As soon as Emu68 starts transmitting debug data, it will appear in the console. To store the debug output while still displaying it, specify a log file name as a parameter:
> FastSerial.exe some_log_file.txt
Listening on fast serial port...
On Linux, additional setup may be required. The system will often load its own default
kernel modules, which conflict with libftd2xx.so when accessing the FT232H chip directly.
If this happens, you will see the following message:
$ ./FastSerial
FT_Open(0) failed, with error 3.
Use lsmod to check if ftdi_sio (and usbserial) are present.
If so, unload them using rmmod, as they conflict with ftd2xx.
In that case, unload the conflicting module with:
$ sudo rmmod ftdi_sio
$ ./FastSerial
Listening on fast serial port...
To avoid repeating this step after each reboot, consider updating your kernel module
blacklist to prevent ftdi_sio from loading automatically. Also, make sure you have
the correct access rights to the USB device so that you do not need to run FastSerial
with administrator privileges.
Watching JIT as it is working
You can modify (or create) the cmdline.txt file on the boot partition where Emu68 resides
to include the keywords
debug disassemble. This enables a special Emu68 mode in which information about each
translated block of m68k code is displayed.
Although the disassembled units are shown in the order they are translated, this does not necessarily reflect the code currently being executed by Emu68. Translation only occurs when a piece of code is needed for the first time, and once translated, that code remains in the JIT cache and will not be re-translated.
Each code dump begins with a hash value and the entry address on the m68k side followed by the code:
[ICache] Creating new translation unit with hash c006 (m68k code @ 0x0000000000f800d2)
[JIT] 00f800d2: bra.w   $f80152              -> 00000000: add     PC, PC, #0x80
[JIT] 00f80152: lea.l   $400.w, a7           -> 00000004: mov     A7, #0x400
[JIT] 00f80156: lea.l   $f80000.l, a0        -> 00000008: mov     A0, #0xf80000
[JIT] 00f8015c: moveq   #$ff, d1             -> 0000000c: mov     D1, #-1
[JIT] 00f8015e: moveq   #$1, d2              -> 00000010: mov     D2, #1
[JIT] 00f80160: moveq   #$0, d5              -> 00000014: mov     D5, wzr
[JIT] 00f80162: add.l   (a0)+, d5            -> 00000018: ldr     w5, [A0:64], #4
[JIT]                                        -> 0000001c: adds    D5, D5, w5
[JIT]                                        -> 00000020: umov    w6, v19.h[5]
[JIT]                                        -> 00000024: mrs     x7, nzcv
[JIT]                                        -> 00000028: bfxil   w6, w7, #0x1c, #4
[JIT]                                        -> 0000002c: cset    w7, hs
[JIT]                                        -> 00000030: bfi     w6, w7, #4, #1
[JIT] 00f80164: bcc.b   $f80168              -> 00000034: b.lo    #0x270
[JIT]                                        -> 00000038: add     PC, PC, #0x14
...
The left column shows the m68k code being translated, while the right column contains the corresponding AArch64 code. If a single m68k instruction requires multiple AArch64 instructions, blank lines are inserted into the left column to visually align the output. Conversely, if several m68k instructions are translated into a single AArch64 instruction, blank lines are inserted in the right column. This alignment makes it easier to see how the translation maps between the two architectures.
Each translated dump ends with one or more exit points from the generated
AArch64 code back to the main JIT loop. The default exit point is labeled
EXIT_DEF. Additional exit points, used for example by conditional instructions,
are labeled sequentially as EXIT_001, EXIT_002, and so on.
Finally, the dump concludes with a summary block followed by a binary dump of the translated AArch64 block. The binary dump can be used with online disassemblers, while the summary block provides:
- the number of m68k instructions translated
- the number of AArch64 instructions generated
- the mean number of AArch64 instructions per m68k instruction
- a CRC32 checksum of the block
- the target memory address where the AArch64 code is stored